Top 10 Ubuntu Network Tools
We will see 10 Ubuntu Network Tools here which are easy to use and provide important features.
1. Iftop
This is one of the easiest tools to use for network usage and DNS operations. When it is started on Ubuntu, we get a simple screen like:
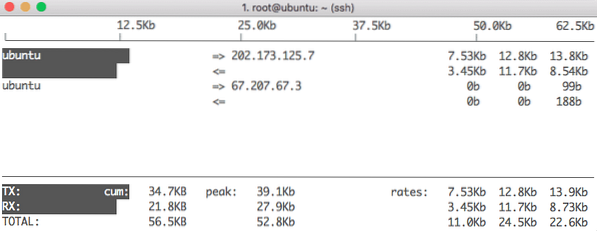
Iftop Home screen
We can press “h” and we will be shown help screen for more features:
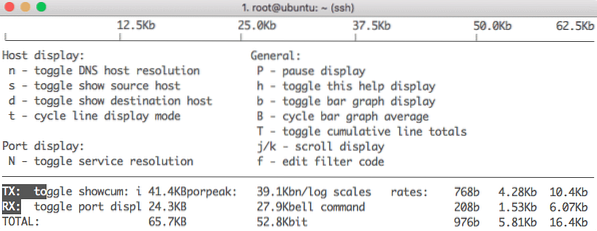
Help screen for iftop
It is very similar to top utility but specialises in network monitoring and knowing which process is using the network at what IP and what bandwidth are they consuming.
2. Vnstat
Vnstat is another network monitoring utility which is usually included in most of the Linux distributions or can be installed very easily. Like the last utility, it allows us to control the network packets sent and received in a given interval of time which is chosen by the user itself. With vnstat help screen, we can see the following features:
$ vnstat --helpvnStat 1.18 by Teemu Toivola
-q, --query query database
-h, --hours show hours
-d, --days show days
-m, --months show months
-w, --weeks show weeks
-t, --top10 show top10
-s, --short use short output
-u, --update update database
-i, --iface select interface (default: eth0)
-?, --help short help
-v, --version show version
-tr, --traffic calculate traffic
-ru, --rateunit swap configured rate unit
-l, --live show transfer rate in real time
See also "--longhelp" for complete options list and "man vnstat".
As it doesn't have a fancy GUI, we are showing the console output here:
$ vnstatDatabase updated: Mon Sep 10 09:52:01 2018
eth1 since 11/20/08
rx: 3.32 TiB tx: 2.81 TiB total: 6.13 TiB
monthly
rx | tx | total | avg. rate
------------------------+-------------+-------------+---------------
Aug '18 609.40 GiB | 282.21 GiB | 891.61 GiB | 2.79 Mbit/s
Sep '18 16.95 GiB | 10.46 GiB | 27.40 GiB | 2.80 Mbit/s
------------------------+-------------+-------------+---------------
estimated 552.14 GiB | 340.70 GiB | 892.83 GiB |
daily
rx | tx | total | avg. rate
------------------------+-------------+-------------+---------------
yesterday 19.19 GiB | 8.63 GiB | 27.82 GiB | 2.70 Mbit/s
today 16.95 GiB | 10.46 GiB | 27.40 GiB | 2.80 Mbit/s
------------------------+-------------+-------------+---------------
estimated 17.81 GiB | 10.99 GiB | 28.80 GiB |
Clearly, it also provides an estimate of the data which will be used at a same rate for the month.
3. Iptraf
Iptraf is another great console-based network monitoring tool for Ubuntu or Linux in general which collects a huge amount of data in terms of IPs which passes through the network with a deep dive in detail like their ICMP flags, TCP faults and byte count. Even a basic interface for the same will look like:
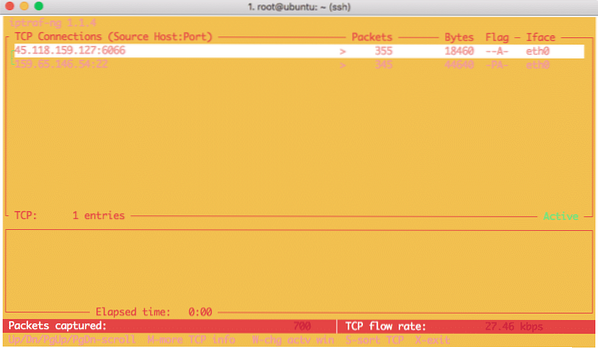
Ubuntu iptraf
Apart from the packet tracking byte count, we have many more features like:
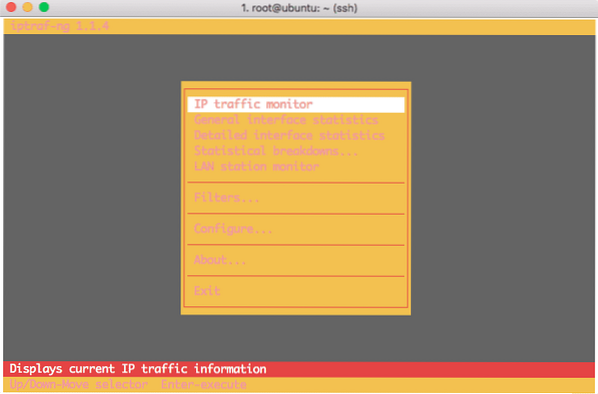
Ubuntu iptraf features
4. Hping3
Hping3 is a command line utility which is similar to Ping command with a small addition that it can use TCP, UDP, and RAW-IP as transport protocols. The main feature is that it doesn't only check if a Port or an IP is open but it also measures the round trip time the packet took to come back. For instance, if we need to check if www.google.com has an open port 443 and calculate the round-trip time, we can use the following command:
hping3 www.google.com -S -V -p 443Here is what we get back with this command:
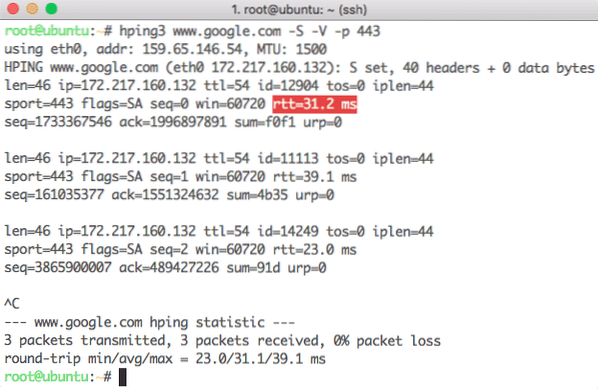
Hping3 round trip
5. Dstat
Dstat is comparatively a less known network monitoring tool in Linux family. Dstat allows us to display all of our system resources in near real-time, we can eg. compare disk utilization in combination with interrupts from our IDE controller, or compare the network bandwidth numbers directly with the disk throughput (in the same interval).
Find more information here for this tool.
6. Icinga
Icinga is an enterprise-grade tool for network monitoring which also takes care of any suspicious activity on the server and informs configured users like admin about such activities. It has a very nice interactive dashboard which looks like:
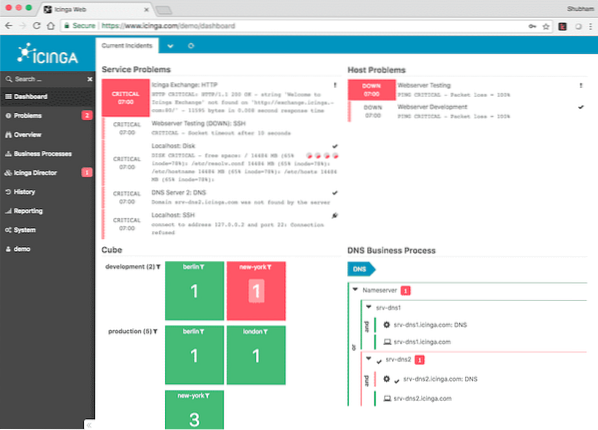
Icinga Dashboard
It is even possible to try a demo dashboard for this tool. Visit this page for more information.
7. slurm
slurm is a smart and simple network load monitoring tool. It has the following features:
- It provides real-time traffic statistics
- It has three graph modes: combined RX and TX and two split views
- It can monitor any network device
- It curses ASCII graphics
- It has an ASCII theme support
It is an open-source networking tool (look here for the source code). It has a basic interface like:
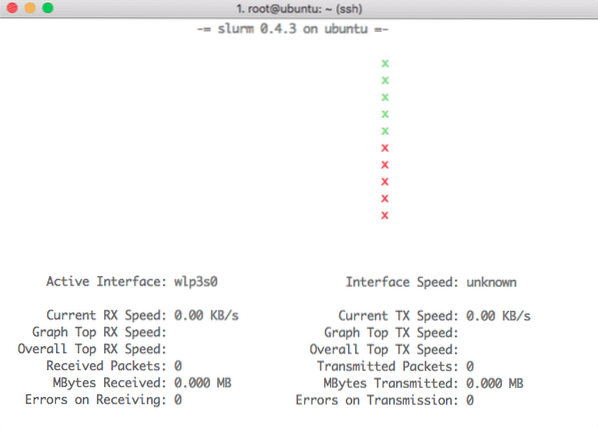
Slurm interface
8. bmon
bmon, which stands for Bandwidth Monitor, is another network monitoring tool with a speciality that it can monitor multiple interface traffic. It also provides information about packets, errors and much more data critical for monitoring. Once installed, here is the list of features it provides for monitoring:
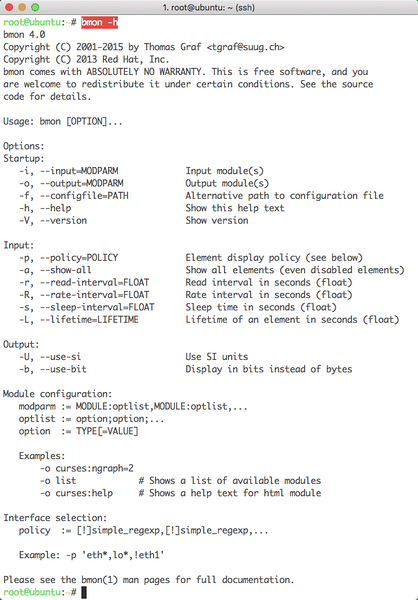
bmon Features
When we start it with a network interface, we will see a simple interface like:
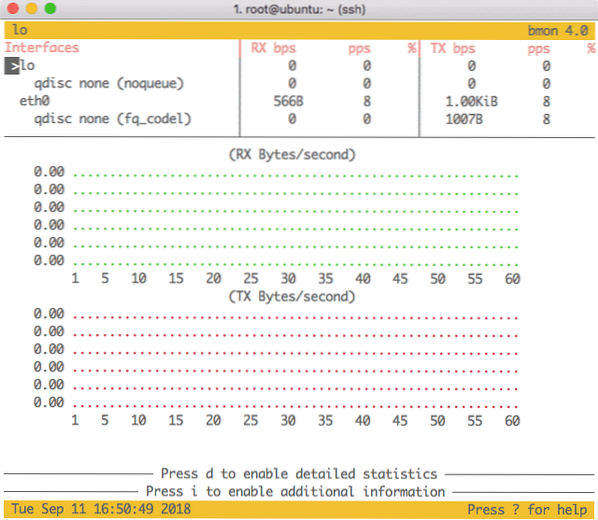
bmon interface
9. Nmap
Nmap is one of the most popular network scanners for common use. The information it can provide includes (but not limited to):
- It can tell what's running on a given network hosts
- Scan and identify open TCP Ports
- Which OS is running on given IP
- Ping sweeps on an IP subnet
We can -O option for OS detection. Let's look at an example command we used:
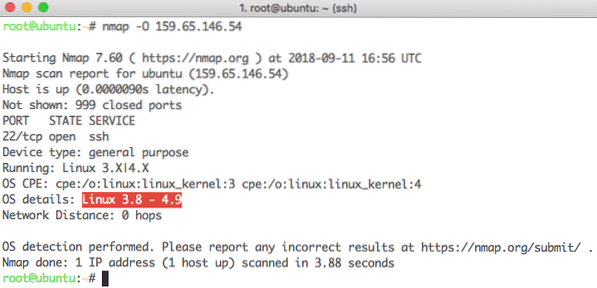
Nmpa Interface
10. Tcpdump
Tcpdump is an excellent tool which goes beyond its scope to provide features like sniffing as well. It can analyze data which is going out of the host and also the data which is arriving on the host. It is possible to intercept the traffic between two hosts with this tool as well (of course you need to have access to those hosts). We first try a command to see what data is going out of our host:
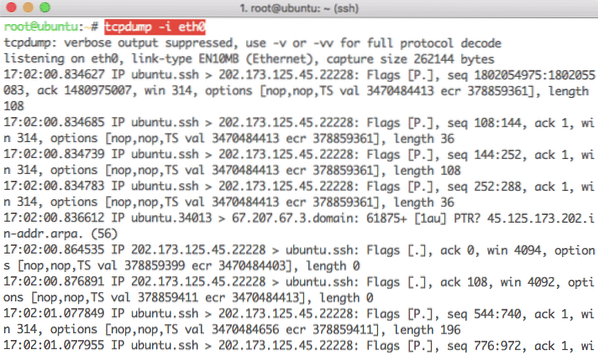
Outgoing Traffic
Next, we can also try to sniff traffic going out of a particular port:
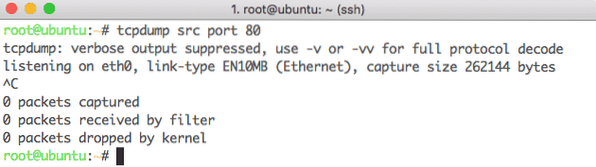
Port Traffic
Conclusion
In this lesson, we looked at some most popular networking tools in the Ubuntu ecosystem. Even though we might have missed some good tools, please mention them to my Twitter handle which you think should have made the cut @sbmaggarwal or @linuxhint.