Organizational chart aka Org chart aka Organogram is an effective way of visualizing the employee hierarchy of an organization. Now, if you want to create an Org chart in Google Docs, there is no native option for that. However, you can try a trick in order to make organizational charts in Google Docs.
As there is no direct way to create an org chart in Google Docs, you will need to use Google Sheets. Create a Google Sheet and import it to Google Docs. Now, you must be wondering how will this create an organizational chart? Well, let's check out in this article how!
How to create an Org Chart in Google Docs
Here are the steps you need to perform to make an organizational chart in Google Docs:
Firstly, open Google Sheets, and then you need to create a Google Sheet with two columns; Employees' Names and respective Reporting Officials.
Do remember that all the names that you have added in Column 2 (Reporting Officials) should be present in Column 1 (Employees). You can see the below screenshot to have an idea of how the sheet structure should be.
Next, select all the cells from the name of the first employee in column 1 to the last name in column 2. To do so, you can use left mouse click + Shift key combination.
Now, go to the Insert menu and then click on the Chart option.
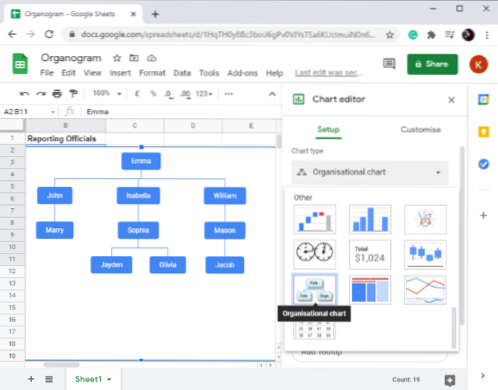
From the Chart Editor option, open the Chart type drop-down menu and then select Others > Organisational chart. This will create an organizational chart for selected data in your Google Sheets.
Next, go to Google Docs and create or open your document in which you want to add an organizational chart.
Go to the Insert menu and tap on Chart > From Sheets option.
Now, choose the Google Sheet that you have created consisting of an organizational chart and click on the Select option.
After that, click on the Org chart that you want to add from the selected Google Sheet and then tap on the Import option. If you want, you can also link the chart to the spreadsheet.
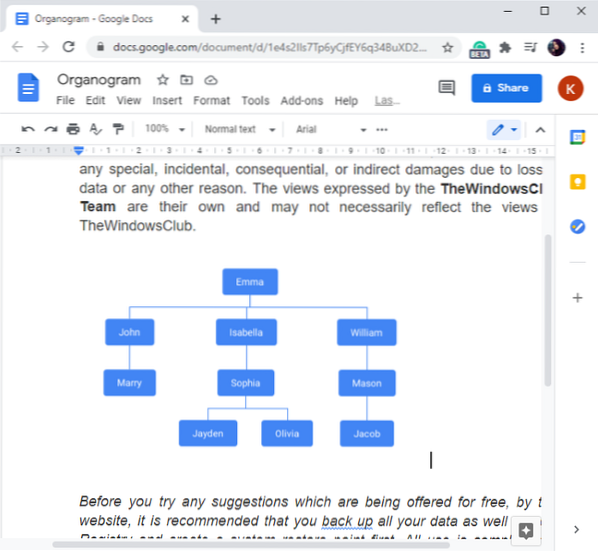
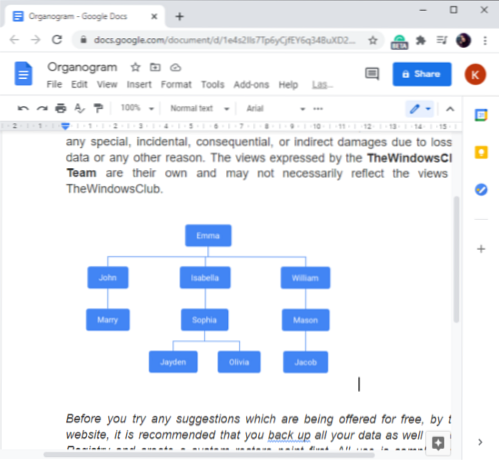
As soon as you click on the Import button, the organizational chart will be added to your Google Docs. You can place it anywhere in the document.
Google Docs is one of the best cloud services to create documents that has many hidden features.
In this article, I have shared tricks to create organizational charts in Google Sheets and then add them to your Google Docs without installing any external plugin.
Hope you find it useful.