ELK Stack is the world's most popular log management platform. It is a collection of open-source products including Elasticsearch, Logstash, and Kibana. All these 3 products are developed, managed and maintained by Elastic.
ELK Stack is a powerful and open source platform that can manage a massive amount of logged data. The inputs log are generally from a graphical web interface (GUI).
- Elasticsearch is a JSON-based search and analytics engine intended for horizontal scalability and easier management.
- Logstash is a server-side data processing interface that has the capability to collect data from several sources concurrently. It then transforms it, and then sends the data to your desired stash. It is an open source application.
- Kibana is used to visualize your data and navigate the Elastic Stack. It is an open source tool as well.
Install and configure ELK Stack on Ubuntu
In this tutorial, we are going to use filebeat to send log data to Logstash. Beats are lightweight data shippers and to begin with, we should have to install the agent on servers.
Step 1) Installing Java 8
ElasticSearch supports Java 8 and 9, but the trouble is Logstash is only compatible with Java 8. Java 9 is not supported yet. Therefore, we are going to install Oracle Java 8.
Launch the Terminal and add Oracle Java 8 repository, followed by a system update, and actual installation.
sudo add-apt-repository ppa:webupd8team/java
sudo apt-get update
sudo apt install oracle-java8-set-default
Pay attention to the Terminal. You will have to agree to license agreement windows and select “yes” to continue. After installation is complete, you can check the java version by using the following commands:
.sudo java -version

sudo echo $JAVA_HOME

Step 2) Installing and Configuring Elasticsearch
Let's start with wget command to download Elasticsearch followed by public signing key:
sudo wget -qO - https://artifacts.elastic.co/GPG-KEY-elasticsearch | sudo apt-key add -
Secondly, install the apt-transport-https package (Debian based distros needs this).
sudo apt-get install apt-transport-https
Add the repository:
echo "deb https://artifacts.elastic.co/packages/6.x/apt stable main" | sudo tee -a /etc/apt/sources.list.d/elastic-6.x.list
Update the repo list and install the package:
sudo apt-get update
sudo apt-get install elasticsearch
Let's modify “elasticsearch.yml” file:
sudo vim /etc/elasticsearch/elasticsearch.yml
Uncomment “network.host” and “http.port”. Following configuration should be added:
network.host: localhost http.port: 9200
Next, save and close the file.
To make sure ElasticSearch works seamlessly, enable it on boot and Start ElasticSearch.
sudo systemctl enable elasticsearch.service
sudo systemctl start elasticsearch.service
Check installation:
sudo curl -XGET 'localhost:9200/?pretty'

Step 3) Installing Kibana
Let's start installing Kibana now and modify Kibana settings:
sudo apt-get install kibana
sudo vim /etc/kibana/kibana.yml
Uncomment following lines:
server.port: 5601 server.host: "localhost" elasticsearch.url: "http://localhost:9200"
Save and exit the File.
Enable it on boot and start Kibana service:
sudo systemctl enable kibana.service
sudo systemctl start kibana.service
Step 4) Configuring Nginx as Reverse Proxy for Kibana
In the similar lines, let's install Nginx, configure it, and start the service. Use the following commands one at a time:
sudo apt-get install nginx apache2-utils
Configure Virtual host:
sudo vim /etc/nginx/sites-available/elk
Add the following configuration to file:
server listen 80; server_name elk.fosslinux.com; auth_basic "Restricted Access"; auth_basic_user_file /etc/nginx/.elkusersecret; location / proxy_pass http://localhost:5601; proxy_http_version 1.1; proxy_set_header Upgrade $http_upgrade; proxy_set_header Connection 'upgrade'; proxy_set_header Host $host; proxy_cache_bypass $http_upgrade;
Create user and password file for web browser authentication:
sudo htpasswd -c /etc/nginx/.elkusersecret elkusr

Enter password and repeat. Check Nginx Configurations:
sudo nginx -t
Enable Nginx on system boot and restart the service:
sudo systemctl enable nginx.service
sudo systemctl restart nginx.service
Step 5) Installing and Configuring Logstash
Install Logstash:
sudo apt-get install logstash
Here we are going to generate SSL certificate key to secure log transfer from file beat client. Modify the “hosts” file before creating the SSL certificate.
sudo vim /etc/hosts
Add the following line to file. Make sure to change IP and server name to yours.
172.31.31.158 elk-server elk-server
When done, save and exit the file.
Now change directory to Logstash.
sudo cd /etc/logstash/
Create a folder for SSL:
sudo mkdir ssl
Generate SSL certificate. Change elk-server to your server name in the below command.
sudo openssl req -subj '/CN=elk-server/' -x509 -days 3650 -batch -nodes -newkey rsa:2048 -keyout ssl/logstash-forwarder.key -out ssl/logstash-forwarder.crt
Create following files inside “/etc/logstash/conf.d”.
sudo cd /etc/logstash/conf.d/
create a filebeat-input file using vim.
sudo vim filebeat-input.conf
Add the following lines to it.
input beats port => 5443 type => syslog ssl => true ssl_certificate => "/etc/logstash/ssl/logstash-forwarder.crt" ssl_key => "/etc/logstash/ssl/logstash-forwarder.key"
Save and close the file and create a new configuration file.
sudo vim syslog-filter.conf
Add the following contents to it.
filter if [type] == "syslog" grok match => "message" => "%SYSLOGTIMESTAMP:syslog_timestamp %SYSLOGHOST:syslog_hostname %DATA:syslog_program(?:\[%POSINT:syslog_pid\])?: %GREEDYDATA:syslog_message" add_field => [ "received_at", "%@timestamp" ] add_field => [ "received_from", "%host" ] date match => [ "syslog_timestamp", "MMM d HH:mm:ss", "MMM dd HH:mm:ss" ]
Save and exit the file. Create elasticsearch output file.
sudo vim output-elasticsearch.conf
Add the following lines to it.
output elasticsearch hosts => ["localhost:9200"] hosts => "localhost:9200" manage_template => false index => "%[@metadata][beat]-%+YYYY.MM.dd" document_type => "%[@metadata][type]"
Let's enable Logstash on boot and start the service:
sudo systemctl enable logstash.service
sudo systemctl start logstash.service
Step 6) Installing and Configuring Filebeat on Client servers
Start with editing the hosts file to add elk host entries. Make sure to replace IP and name with yours.
sudo vim /etc/hosts
172.31.31.158 elk-server
Save and exit the file.
Download and install the Public Signing Key:
sudo wget -qO - https://artifacts.elastic.co/GPG-KEY-elasticsearch | sudo apt-key add -
Install “apt-transport-https” and add repo.
sudo apt-get install apt-transport-https
sudo echo "deb https://artifacts.elastic.co/packages/6.x/apt stable main" | sudo tee -a /etc/apt/sources.list.d/elastic-6.x.list
Update repo and install Filebeat.
sudo apt-get update
sudo apt-get install filebeat
Modify Filebeat configurations.
sudo vim /etc/filebeat/filebeat.yml
Find the following line and modify the value to “true”.
enabled: true
Here we are not modifying log path and Filebeat will forward all logs inside “var/log” folder
paths: - /var/log/*.log
Uncomment the following lines:
output.logstash: # The Logstash hosts hosts: ["elk-server:5443"] ssl.certificate_authorities: ["/etc/filebeat/logstash-forwarder.crt"]
Comment Elasticsearch:
#output.elasticsearch: # Array of hosts to connect to. # hosts: ["localhost:9200"]
Save and exit the file.
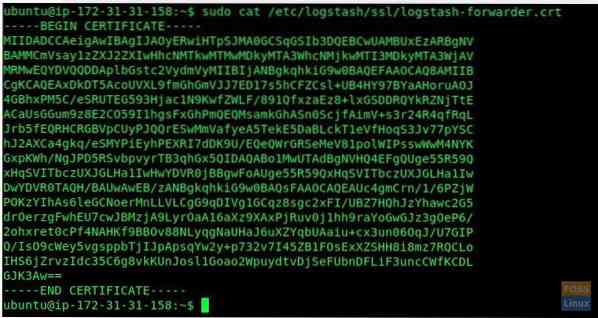
Now go to ELK server and get “logstash-forwarder.crt” contents
sudo cat /etc/logstash/ssl/logstash-forwarder.crt

copy output and then go to Elk client-server.
Create a certificate file
sudo vim /etc/filebeat/logstash-forwarder.crt
insert copied output and save & exit.
Enable filebeat on system boot Start filebeat service.
sudo systemctl enable filebeat.service
sudo systemctl start filebeat.service
Step 7) Browsing the Kibana Dashboard
Launch your favorite web browser and enter the domain name followed by username and password.
http://elk.fosslinux.com

Enter the created user name and password. You should see the Kibana Welcome page. Click “Explore my Own” button.

You should be directed to the Kibana Home Page.

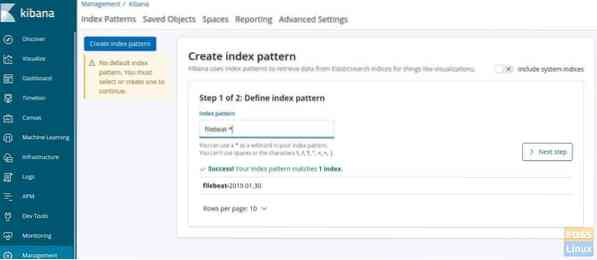
Click “Discover” on the left side. Click “Create index pattern”.

Then define the index pattern “filebeat-*”.

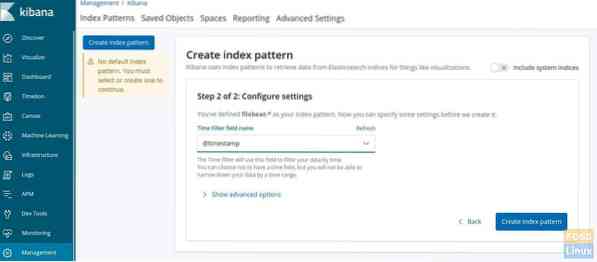
Click next and choose @timestamp' and click 'Create index pattern'.

Index pattern should get created.

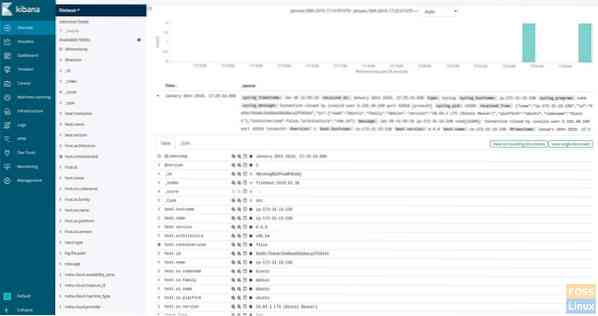
Click the “Discover” Menu to see the server logs.

Logs will be shown as per the time stamp. Click on any timestamp to expand it and see the log file contents and its details.

If you reached here, it implies you have successfully installed and configured the ELK stack with filebeat. Got any issues? Feel free to let us know in the comments below.
 Phenquestions


