OProfile is a performance profiler for Linux. In this article, we'll explore what it does, how to install and configure it, and how to put the data it assembles to use.
You might wonder why you would need a tool like this as there are plenty of good performance analysis tools available by default on most Linux distributions. Every install includes tools like top and vmstat, and tracing utilities like strace are usually just an apt-get away. Where does OProfile fit in?
The tools previously mentioned are excellent at obtaining a snapshot of a Linux system in real time. Tools like top or htop show all running processes, their current memory consumption, and processor usage. But knowing what processes and system calls are consuming the most resources becomes problematic.
That's where OProfile comes in. This utility suite not only performs its analysis at a deeper level, but also saves data and allows you to produce performance reports that offer a wealth of information that can help you debug even the most elusive performance issue.
OProfile is not just for developers. In a desktop environment, OProfile can help you track down CPU-intensive background tasks or I/O calls that are slowing you down and aren't immediately evident. On a busy system with shifting process priorities, this data can be hard to collect, let alone interpret. The multi-process nature of a server environment makes this task even more difficult with traditional tools.
That said, developers will no doubt get the most use out of OProfile. The information I'll present will cover the basics of both use cases so you can dig into the performance metrics of any Linux program.
Installation
There is a very important note that must be made before diving deeply into OProfile - you may not be able to install it in a virtualized environment. If you are running Linux inside a VirtualBox, VMWare, or similar VM environment, OProfile may not be able to access the necessary performance counters to collect data. Furthermore, even if you are able to use it in a virtual environment, precise timing may be somewhat distorted based on host system load, so please keep this in mind if you aren't running on native hardware.
Several Linux distributions have OProfile in their package management systems, making installation easy:
- Debian / Ubuntu / Linux Mint - sudo apt-get install oprofile
- Fedora / CentOS - sudo yum install oprofile
- Arch - sudo pacman -S oprofile
A Simple Example
Once the program is installed, let's get our feet wet with a trivial yet useful example. The program “ls” is a command you probably use all the time. It simply displays a list of files and folders in the current directory. Let's trace its output:
sudo operf ls
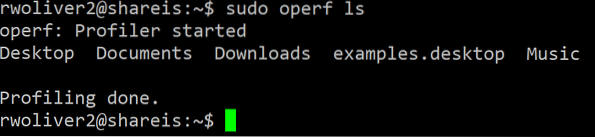
You'll see something similar to the above screen shot. Once the profiler is finished, it will announce “Profiling done.” It has saved it's data in a folder called oprofile_data which can be used to generate a report.
Running the command opreport (without sudo in this case) produces a report similar to this:
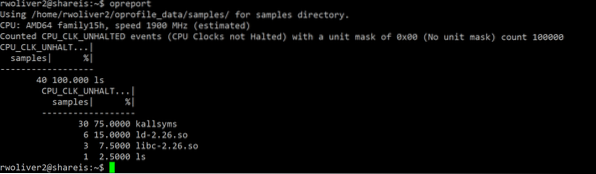
In this example, the default report shows the number of samples when the CPU was not in a HALT state (in other words, was actively doing something). Kallsyms provides symbol lookup used by the profiler, and the ld.so and libc.so are part of the glibc package, a common library linked into nearly all Linux executables that provides basic functionality developers can use to keep from reinventing the wheel and provide a generic level of compatibility between various systems. You can see that the actual program ls had far less non-HALT time - the bulk of the heavy lifting was done by the standard libraries.
Once we're done with the report, it's a good idea to either remove the data folder or save it for future analysis. In this example, we'll just remove it since we're running sample exercises. Since we ran the command with sudo, we must remove the folder with sudo. Be careful!
sudo rm -Rf oprofile_data
A More Complex Example
In this next example, we'll run a program that actually does something more complex than just list files in the current folder. Let's download WordPress with wget.
sudo operf wget http://wordpress.org/latest.tar.gz
After this example, we can generate a report with the “opreport” command:

You'll see a lot more activity after this one. The wget command had to do a lot of work behind the scenes to obtain the latest copy of WordPress. Though it's not necessary to examine each item, the interesting points of interest are:
- ath9k and ath9k_hw - These modules are responsible for the WiFi connection on this laptop.
- mac80211 and cfg80211 - These libraries were instrumental in performing the network connection required by wget.
- libnss_dns and libresolv were used in resolving the wordpress.org domain into an IP address so wget could make an HTTP connection.
- libcrypto and libssl - These libraries are part of the OpenSSL library. This performed the work to decode the received data from the https:// url. Note that even though we specified a URL with http://, the WordPress server redirected us to https:// and wget followed this redirect.
- libpthread - This library performs threading operations which allow programs to do multiple things at once. In this case, wget started a thread to download the program and also provide an ASCII-based download progress indicator on the screen.
This kind of data can provide a wealth of information for a developer. But how is this important to a system administrator of a server or a power user on a desktop? By knowing which parts of a program are taking the most CPU time, we can find out what needs optimization or where the slowdown is occurring, allowing us to make better decisions about how to optimize our system.
In this example, the most CPU time was taken by the crypto/SSL routines. This is understandable because cryptography is a time consuming task. Had the wordpress.org website not redirected us to https:// this library would not have been used, saving us CPU time. The network layer would still have been used, but using a wired connection instead of a wireless connection would likely have been less taxing. Disabling the progress indicator on the wget program (via the -nv switch) would have saved CPU time in displaying download progress.
Digging Into Symbols
Even though the default report provides valuable and useful information, we can dig further. By running this:
opreport --demangle=smart --symbols
We can find out exactly how much CPU time functions in the libraries consumed:
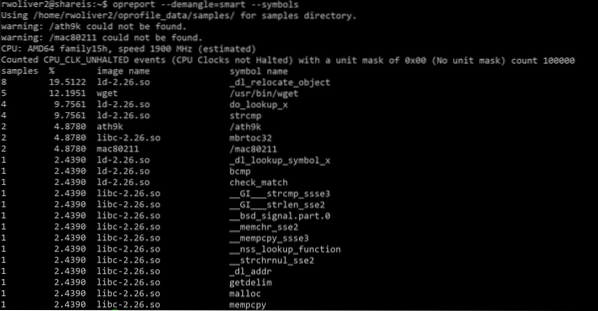
In this example, I used the wget command above but used an http:// URL (one that doesn't redirect to https://) and you can see the absence of OpenSSL libraries in the trace. However, instead of just the library name, we now have a full listing of the functions involved. As you can see, the network layer consumed most of the CPU non-HALT time.
Taking it to the Next Level
In the previous examples we've used OProfile to take a look at one program at a time. You can examine your entire system at once using the -system-wide switch:
sudo operf --system-wide
Using this technique, OProfile will gather statistics in the same manner and stop when you hit CTRL+C. Afterwards, you can run the opreport command. Since the profiler will likely generate much more data (especially on a desktop or busy server).
opreport > report.txt
The report is now viewable in a file called report.txt
Low Overhead
It is important to note that while OProfile shouldn't interfere with the operation of your programs, it will create a bit of overhead and thus slow down execution. In our simple examples above it didn't create a problem, but on a program with long execution and extensive function calls you will likely notice a difference. Because of this, I wouldn't recommend using this program in a production server environment unless faced with a critical performance problem that must be solved with live usage. Even then, I would use it just long enough to find the issue.
Conclusion
OProfile is a powerful performance profiling tool. It taps into the lowest level available in Linux to obtain performance counters and metrics that give you valuable information about your programs.
Gone are the days of guesswork in performance debugging - you now have the power to know precisely what your system is doing and how to improve it. By studying the reports generated by OProfile, you can make informed, data-driven decisions on optimizing your system.


