This article will list some of the command line apps available in Linux to monitor hardware sensors. Many graphical apps use these command line tools as base, especially the first two apps mentioned below.
Lm-sensors
Lm-sensors is a suite of command line apps for monitoring and viewing sensor data. It can show sensor information like fan speed, voltage, temperature and so on.
To install Lm-sensors in Ubuntu, run the command below:
$ sudo apt install lm-sensorsAfter the installation has finished, run the command below to identify sensors on your system:
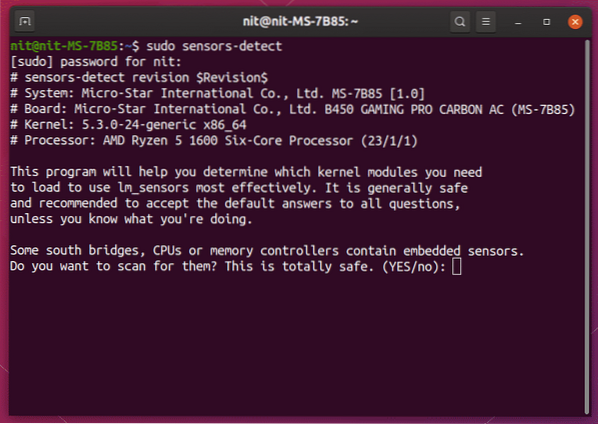
$ sudo sensors-detectLm-sensors will show some prompts in terminal and request your input. Read each prompt carefully and answer in YES/no. These prompts can be different for different systems depending on hardware configuration, so there is no one standard way to configure the sensors. It is necessary to complete this command line configuration wizard otherwise wrong or only partial information about sensors may be available.
After you have answered all the questions, reboot your system and run the command below to check CPU temperature, GPU temperature, fan speed, voltage etc. in the terminal:
$ sensors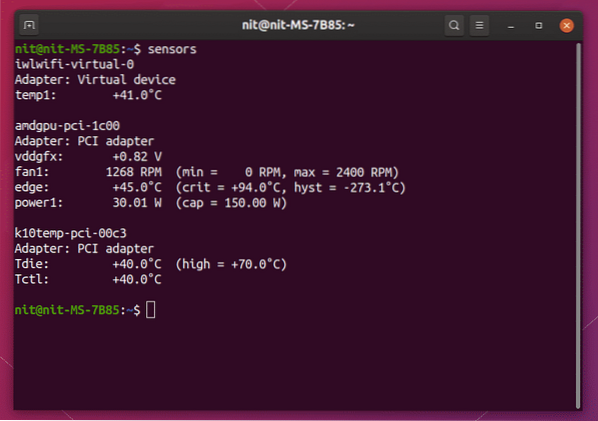
If you prefer Fahrenheit units instead of Celsius, run a modified command mentioned below:
$ sensors -fTo automatically update temperature values every second, run a command in the following format:
$ watch -n 1 sensorsHere “-n 1” refers to the time interval in seconds between updates.
Psutil
Psutil is a Python module that can look up hardware information, active processes and real time system utilization data. Since Psutil can show a lot of data about your hardware, you can effectively use it as a replacement for multiple command line apps and bash commands that are used separately for retrieving various hardware utilization values.
To install Psutil in Ubuntu, run the command below:
$ sudo apt install python3-psutilOnce the installation has finished, run the command below to quickly view CPU and GPU temperature:
$ python3 -c "import psutil; import pprint; pprint.pprint(psutil.sensors_temperatures())"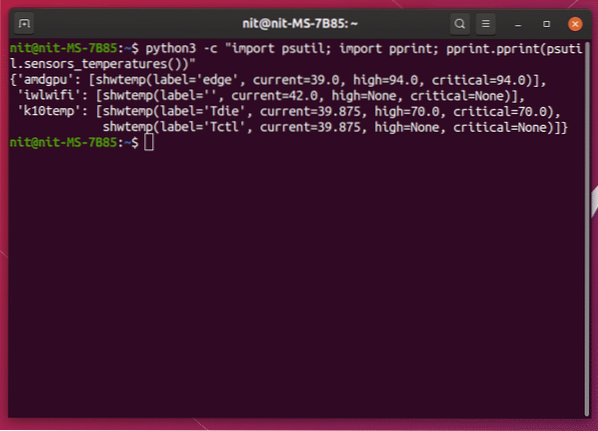
To continuously show temperature every second, run the command below:
$ watch -n 1 -x python3 -c "import psutil; import pprint;pprint.pprint(psutil.sensors_temperatures())"
Here “-n 1” refers to the time interval in seconds between updates.
Since Psutil is a Python library, you can use it in Python scripts and GUI apps made in Python. A couple of nice scripts provided by official Psutil documentation can be used to view well formatted output in the terminal.
The first script “temperatures.py” can be downloaded from here. Run the command below to view temperature values once you have downloaded the file:
$ python3 ./temperatures.py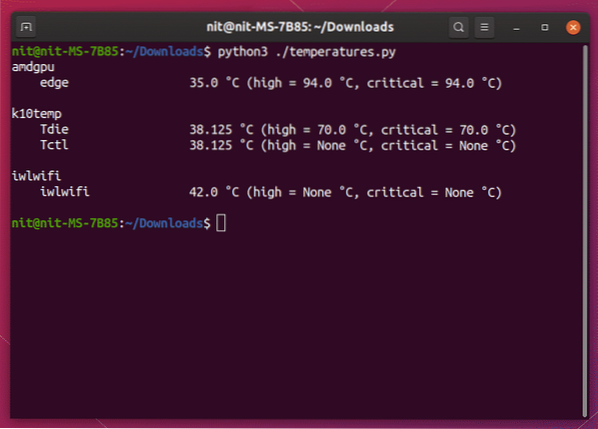
To continuously view temperature values at a fixed interval of one second, run the command below:
$ watch -n 1 -x python3 ./temperatures.pyThe second script called “sensors.py” can be downloaded from here. In addition to temperature values, this script also provides fan speed in RPM, battery level and so on. Run the command below once you have downloaded the file:
$ python3 ./sensors.py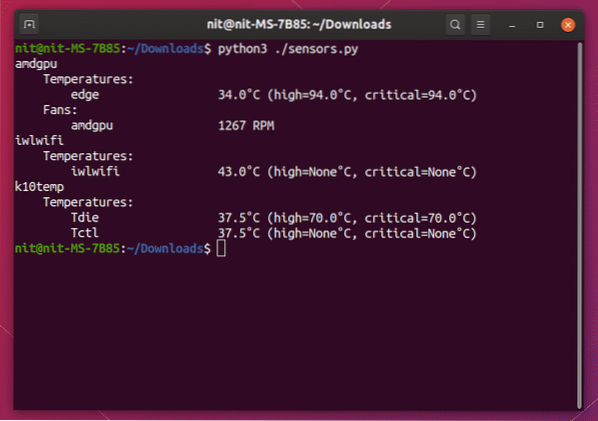
To continuously view temperature values, fan speed etc. at a fixed interval of one second, run the command below:
$ watch -n 1 -x python3 ./sensors.pyHardInfo
HardInfo is a graphical app that displays information about various hardware components in your system. It can also do certain benchmarks to measure performance and can export detailed reports in text and html formats.
To install hardInfo in Ubuntu, run the command below:
$ sudo apt install hardinfoAlong with the GTK app, it also provides a command line interface as capable as the graphical frontend. To view sensors and current temperature values using HardInfo, run the command below:
$ hardinfo -rma devices.so | grep -A 10 Sensors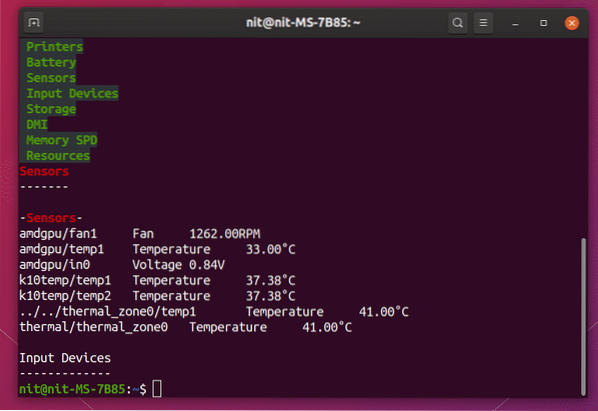
Glances
Glances is a “top” like tool for Linux that shows real time hardware utilization data in a terminal. It is written in Python language and in fact it uses Psutil library mentioned above. However, it comes with a lot of extra features like a built-in lightweight server, RESTful JSON API, web UI that can be viewed in a browser, CSV export and so on. If you have used tools like top / htop, it looks and works similar to them.
To install Glances in Ubuntu, run the command below:
$ sudo apt install glancesTo see sensors and their temperature values along with other hardware information, run the command below:
$ glances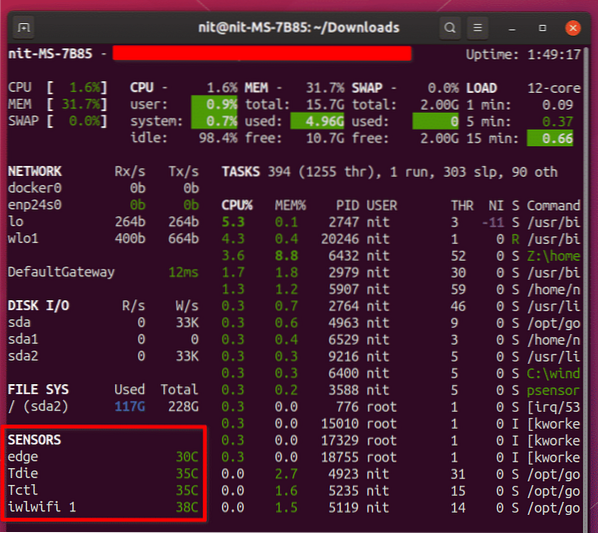
To view temperature values in Fahrenheit units, run the command below:
$ glances --fahrenheitTo view only sensors data and nothing else, run the command below:
$ glances -t 1 --stdout sensors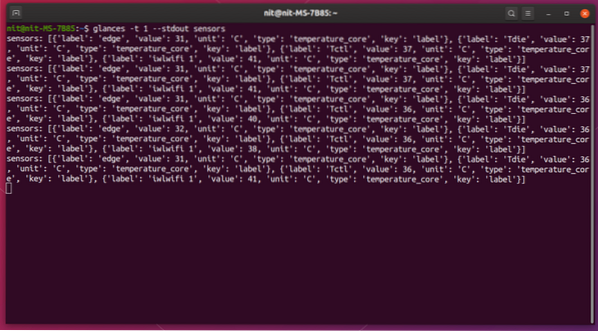
Here “-t 1” refers to the time interval in seconds between updates.
Conclusion
These are some of the command line apps available for Linux to monitor temperature of hardware components on a system. These apps are light on CPU and memory consumption and they are ideal for remotely monitoring servers.